Management Dashboard
The SkipTrack Management Dashboard is your daily control center for managing waste collection operations. It provides an at-a-glance view of today's activities, fleet status, and business performance.
Getting Started
After logging in and selecting your company, you'll land on the dashboard. This is where you should start each day to get an overview of your operations.
What You'll See
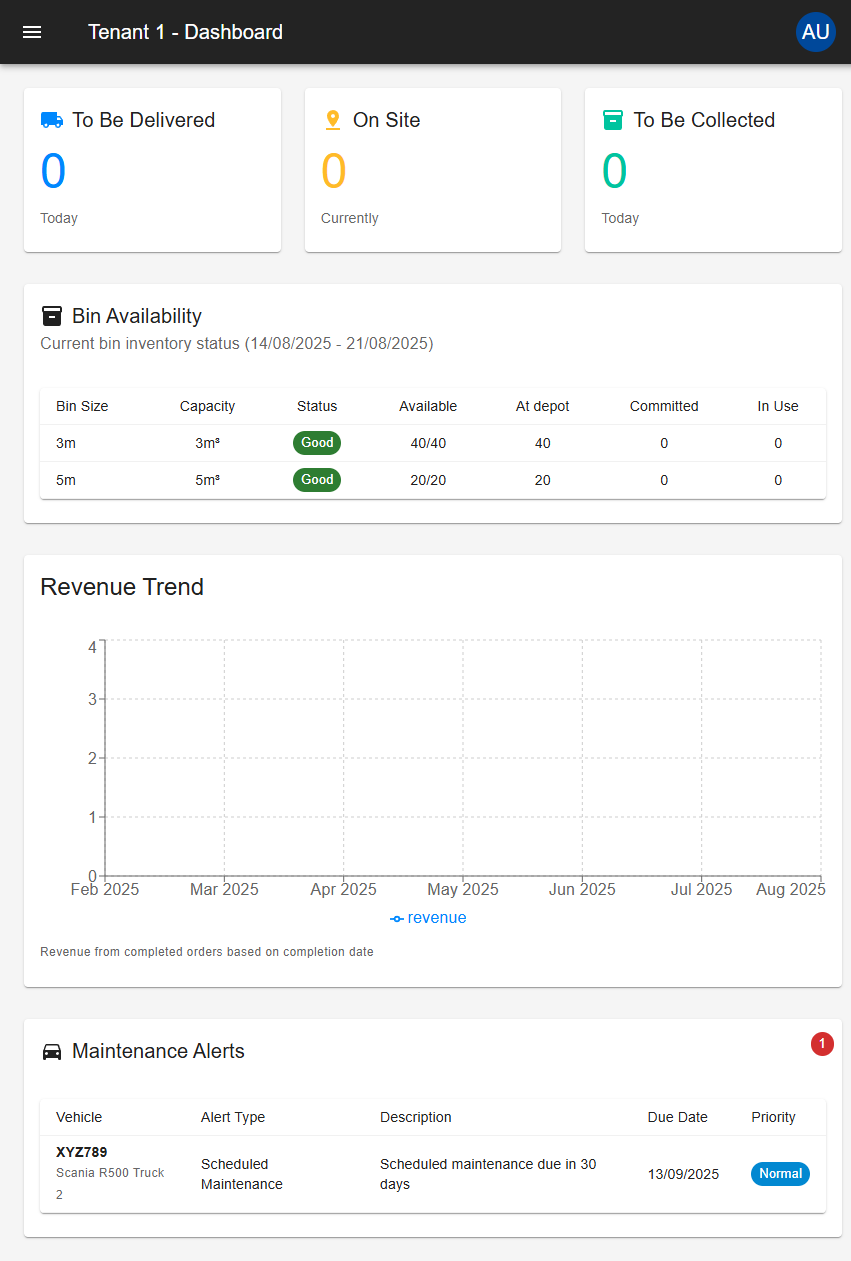
Today's Activity
At the top of the dashboard, three cards show your current workload:
Deliveries Scheduled Today
Shows how many bins need to be delivered to customers today. This helps you plan your delivery routes and driver assignments.
Bins Currently On Site
Displays how many bins are currently placed at customer locations. This gives you an overview of your active placements.
Collections Scheduled Today
Shows how many bins need to be picked up from customers today. Use this to plan collection routes and ensure you have enough truck capacity.
Bin Inventory Status
This table shows your current bin availability:
- Bin Size: The different bin sizes you offer
- Available: How many bins are ready for delivery
- At Depot: Bins currently stored at your facility
- Committed: Bins already assigned to upcoming orders
- In Use: Bins currently placed with customers
Status Colors:
- Green (Good): 50% or more of your bins are available - you're well stocked
- Orange (Low): 20-49% of your bins are available - consider restocking soon
- Red (Critical): Less than 20% of your bins are available - immediate action needed
- Gray (No Stock): No bins of this size in your inventory
Revenue Trends
The chart shows your revenue performance over the past 6 months, based on completed orders only. This gives you an accurate picture of money actually earned, not just orders placed.
What counts as revenue:
- Only orders that have been fully completed (delivered and collected)
- Revenue is recorded in the month when the order was completed, not when it was placed
- Uses the final order price (including any manual price adjustments you made)
Use this chart to:
- Track business growth month by month
- Identify seasonal patterns in your revenue
- Compare current performance to previous months
- Plan for future capacity and resources
Maintenance Alerts
This section shows vehicles that need attention:
- Vehicle details: Which truck needs maintenance
- What's needed: Type of maintenance required
- When: Due dates for scheduled maintenance
- Priority: How urgent the maintenance is
Priority Levels:
- Normal: Schedule when convenient
- High: Address within a few days
- Critical: Immediate attention required
Common Questions
Why are my statistics showing zero?
This usually means no orders are scheduled for today. Check your Orders section to verify.
How often does information update?
The dashboard updates automatically throughout the day as orders are completed and data changes.
Can't see certain sections?
Some dashboard sections may be hidden based on your user permissions. Contact your administrator if you need access to additional features.
Getting Help
If you encounter issues or need assistance:
- Try refreshing the page
- Check your internet connection
- Contact your system administrator
- Refer to other sections in this documentation
The dashboard is designed to give you all the information you need to run efficient daily operations. Start each day here to stay on top of your business!